Results
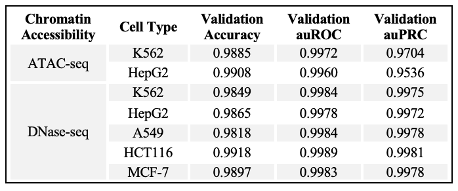
Table 1. DECODE training and testing performance: Out-of-sample validation performance metrics for each chromatin accessibility and cell type.
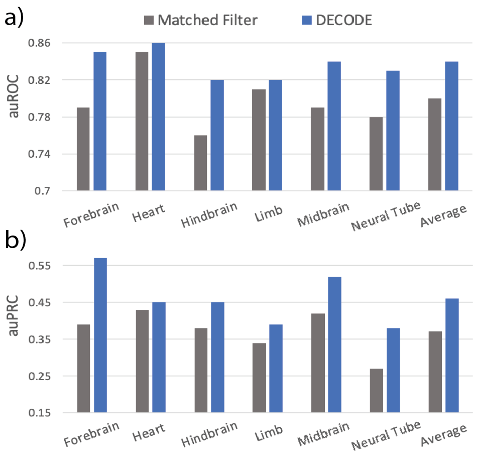
Figure 3. Benchmarking Against Matched Filter-Based Model: We benchmarked our trained model against the state-of-the-art model using transgenic mouse enhancers. DECODE produced validation metrics (a, auROC; b, auPRC) that outperformed the state-of-the-art model in all tissue types.
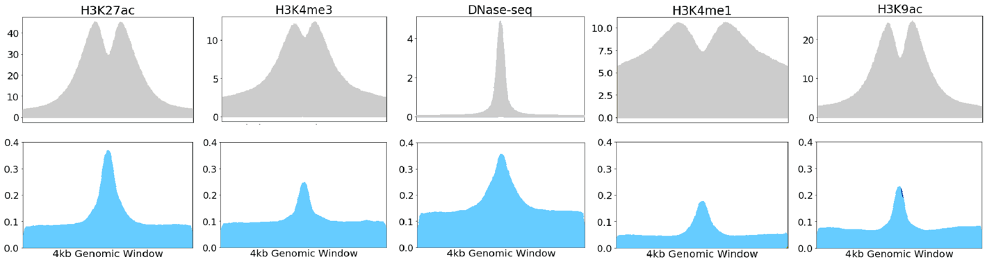
Figure 4. Feature-wise Grad-CAM score: Original signal (top row) and feature-wise Grad-CAM score (bottom row) over a 4 kb window for the five types of input epigenetic marks.
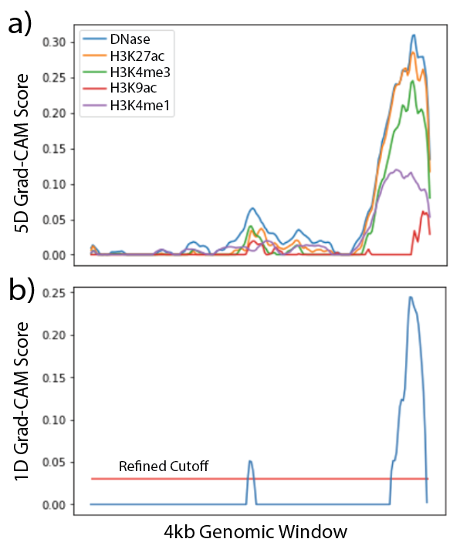
Figure 5. Feature-wise and Position-wise Grad-CAM Values: a) 5-D and b) 1-D Grad-CAM justification of a positive prediction.

Figure 6. NPC Whole Genome Prediction Validation: a) Procedure to predict enhancer windows and generate refined regions. b) Total nucleotide coverage and total transcriptional start site overlap for the original versus refined set. c) Conservation analysis of the PhastCons score distribution and the rare DAF SNP enrichment of the refined set compared with original set. d) LDSC enrichment of psychiatric and neurodevelopmental phenotypes for the original and refined set.